An Impact in the Billions
East Carolina University generates $2.8 billion for North Carolina’s economy— dollars that make a mark on the state, eastern North Carolina, and our local area.
These dollars come from research and entrepreneurship and from students and visitors who come to our state.

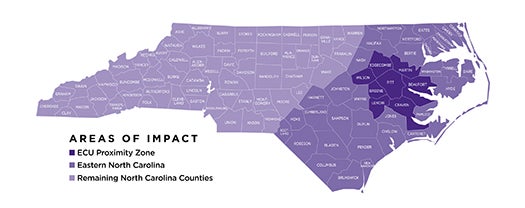
In fiscal year 2012-13, the $795.3 million in payroll and operations spending of ECU, together with the construction spending and spending by students, visitors, and alumni, created $2.8 BILLION to the state, $1.8 BILLION to the eastern region, and $1.3 BILLION to the ECU proximity zone. Click image for larger view.
In addition, ECU produces professionals for many fields important to our state, such as medicine, dentistry, nursing, teaching, engineering, technology, science, business, and the arts.
The added income these graduates will earn as a result of their educations rises into the billions.

A graph showing ECU’s impact on North Carolina
Return on Investment to Students, Society, and Taxpayers
Student Perspective
Students attending ECU during fiscal year 2012–13— our analysis year—paid a total of $189.8 million for tuition, fees, books, and supplies. They also passed up $526.3 million in income they could have earned had they been working instead of in school.
In return for the money students invest to earn their degrees, they will receive an estimated $2.1 billion in today’s dollars in increased earnings over their working lives.
This translates to a return of $2.90 in higher future income for every $1 that students invest in their ECU educations. The average annual return for students is 12.6 percent.
Societal Perspective
North Carolina as a whole will receive $10.2 billion in today’s dollars in added state income over the course of the students’ working lives. Communities will benefit from $1.6 billion in savings due to reduced crime, lower unemployment, and better health and well-being.

Click on image for larger view
Taxpayer Perspective
In fiscal year 2012–13, North Carolina taxpayers invested $294.1 million (excluding clinical dollars) to support ECU operations. The net present value of the added tax revenue stemming from the students’ higher lifetime incomes and the increased output of businesses amounts to $989.5 million. North Carolina’s public sector will save another $284.7 million due to a reduced demand for government-funded services.
Dividing benefits to taxpayers by the associated costs yields a 4.3 benefit-cost ratio. Thus, every $1 in cost returns $4.30 in benefits. The average annual return on investment for taxpayers is 12.3 percent.
Impact on the State and Regional Business Community
* Our estimated economic impacts are conservative in that we directly take into account the fact that state and local dollars spent on the university could have been spent elsewhere in North Carolina and thus would have created some economic impacts regardless.
We account for these alternative uses directly in our analysis by (i) assuming that if funds were not directed to ECU, they would have been returned to the taxpayer and generated economic impacts through household spending on goods and services and (ii) subtracting the estimated economic impacts generated by these alternative uses from the estimated economic impacts of ECU.
Thus, we report a net impact of ECU that is above and beyond what would have occurred had the funds been returned to the taxpayer.
In fiscal year 2012–2013, ECU spent $524.6 million on payroll and benefits for 7,301 full-time and parttime employees and another $270.7 million on goods and services to carry out daily operations and research.
This initial round of spending creates more spending across other businesses throughout the state and regional economies, resulting in what is commonly referred to as multiplier effects. This study estimates these multiplier effects and reports the additional economic activity that is created by the initial spending of ECU.*
Impacts are reported in terms of total income, similar to gross regional product, and the corresponding number of jobs created.
East Carolina University created $2.8 billion in added state income in FY 2012-13, equivalent to 42,798 jobs.
Impact of Spin-Off Companies
Spin-off companies include those created and fostered through programs at ECU that support entrepreneurial business development as well as companies created by faculty, students, or alumni from their work at ECU.
These impacts are important because they make up a significant part of the region’s business environment. The connection between ECU and its related spin-off companies is less direct than with start-up companies licensing ECU technology. For this reason, the impact of business spin-offs related to ECU is presented separately for the university in this analysis.
State
The collective impact of spin-off companies related to ECU in fiscal year 2012–13 was $1.3 million in added state income, equivalent to 13 new jobs.
Regional
The collective impact of these spin-off companies in fiscal year 2012–13 was $926,100 in added regional income, equivalent to 10 new jobs.
Proximity Zone
The collective impact of these companies in fiscal year 2012–13 was $224,600 in added income in the eight counties closest to ECU, referred to as the economic proximity zone, equivalent to four new jobs.

Operations Spending Impact
Payroll and non-pay expenditures to support ECU’s day-to-day operations (less clinical and research operations) amounted to $349.3 million and $197.2 million, respectively.
State
The net impact of the university’s operational spending in North Carolina during the analysis year was approximately $389.2 million in added income, equivalent to creating 5,473 jobs.
Region
In the eastern region, the net impact was approximately $460.8 million in added income, equivalent to creating 6,890 jobs.
Proximity Zone
And in the counties closest to ECU, the net impact was approximately $448.9 million in added income, equivalent to creating 6,779 jobs.
Clinical Spending Impact
In fiscal year 2012–13, the ECU Division of Health Sciences spent $210.5 million on clinical faculty, staff, and other costs to support its operations in North Carolina.
State
Across the state, the total net impact of these clinical operations was $298.5 million in added income, equivalent to creating 3,653 new jobs.
Region
The total net impact of these clinical operations in the region was $235.6 million in added income, equivalent to creating 2,919 new jobs.
Proximity Zone
Locally, ECU’s clinical operations had a total net impact of $220.6 million in added.
